


 10 / 32

10
/ Canadian Government Executive
// December 2016
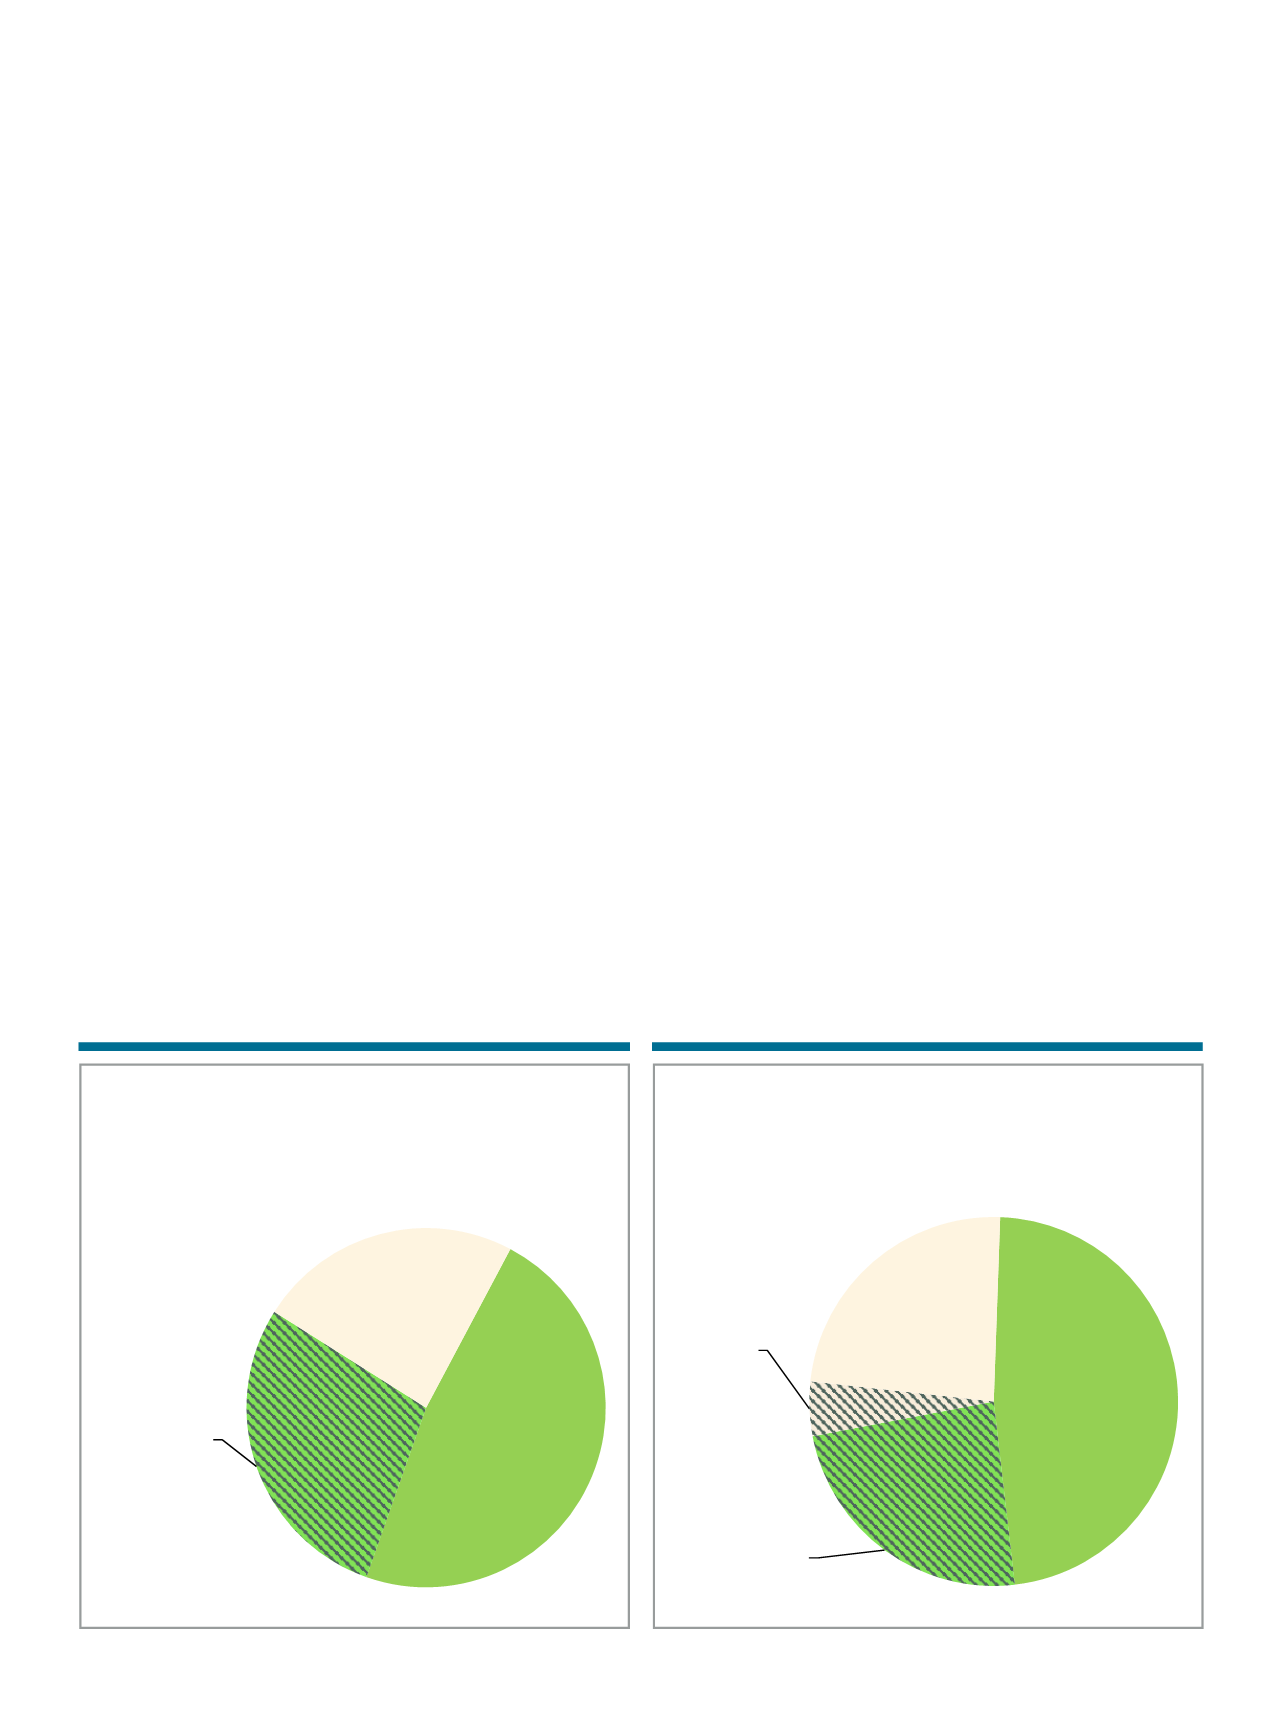
Figure 1.
Presence of Logic Model among
Programs at Access Alliance
(Apr. 2011 - Sept. 2014)
Figure 2.
Evaluation Activity of Programs at
Access Alliance
(Apr. 2011-Sep. 2014)
ance, as well as to create a useful dialogue
around the challenges and opportunities
surrounding future changes in program
planning, delivery, and evaluation. This
audit resulted in synthesized recommen-
dations for future planning and evaluation
practices that will ultimately strengthen
the organization’s application of the Pro-
gram Planning and Evaluation Policy.
Ultimately, this audit represents an at-
tempt to practice lateral accountability
to itself in terms of its ability to carry out
its own mission-based activities. Access
Alliance’s experience demonstrates that
an organization-wide program evalua-
tion audit is not only conceivable but also
achievable, and encourages this process
within the community health sector, as
well as more broadly within the non-prof-
it sector.
The Audit Process
This evaluation audit used a mixed
method approach. The first step was to
enumerate programs with or without a
logic model – the counterfactual method
of auditing. Twenty-one programs were
screened using the following two indica-
tors: (i) a logic model (Figure 1), and (ii)
evaluation activity within the past three
years (Figure 2). Typically, programs syn-
Access Alliance: The
Organization Committed
to Evaluation
Founded in 1989, Access Alliance Multi-
cultural Health and Community Services
(Access Alliance), a Toronto Community
Health Centre, provides primary health,
settlement, and community services to
Toronto’s vulnerable immigrant, refugee,
and racialized groups. It exists to address
the systemic barriers faced by these com-
munities. The aim is to improve their im-
mediate and long-term health outcomes.
Considering the marginalized nature of
their clients, it is all the more important
that Access Alliance upholds its commit-
ment to maintaining a culture of evidence-
informed planning and decision-making
through continuous process and outcome
evaluation activities. This commitment is
embodied within the Program Planning
and Evaluation Policy, a peer-reviewed,
organizational document that emphasizes
the importance of generating high quality
evidence and developing the elements
of an effective evaluation framework
through evidence-informed planning.
The evidence generated through this au-
dit was used to identify and describe the
gap in compliance between current evalu-
ation policy and practice at Access Alli-
thesize a variety of sources including stra-
tegic plans, work plans, and program ad-
ministration data to create a unique logic
model. The logic model, a fundamental
component of evaluation practices, out-
lines the rationale, goals, activities, and
outcomes in a program, depicting the rela-
tionship between each component.
Findings from this study showed that
the odds of having completed evaluation
is 6.5 times higher for programs using log-
ic models than for programs without, im-
plying that having a logic model is condu-
cive to evaluation practice [odds ratio: 6.5,
95% CI 0.73-57.4, p>0.05]. However, these
programs do not run in a vacuumwhereby
other confounding factors may help to de-
scribe the affinity of a particular program
to evaluation practice.
The second step of the audit process
comprised interviews with program
managers, team leads, and relevant staff
members to contextualize the document-
ed evaluation practices and describe the
gap between these practices and orga-
nizational evaluation policy/standards.
Three themes emerged as key drivers for
efficient evaluation practices: high quality
data, an organizational culture of evalua-
tion, and supportive leadership.
Program Evaluation
Department logic
model,
47.6%
Program-Specific
logic model
28.6%
No logic model
23.8%
Department logic
model,
47.6%
Program-Specific
logic model
28.6%
No logic model
23.8%
Eval.
completed, next
planned
47.6%
Eval.
completed,
none planned
23.8%
No eval.
completed,
none planned
4.7%
No eval.
completed, next
planned
23.8%