


 16 / 32

The Dashboard
16
/ Canadian Government Executive
// February 2016
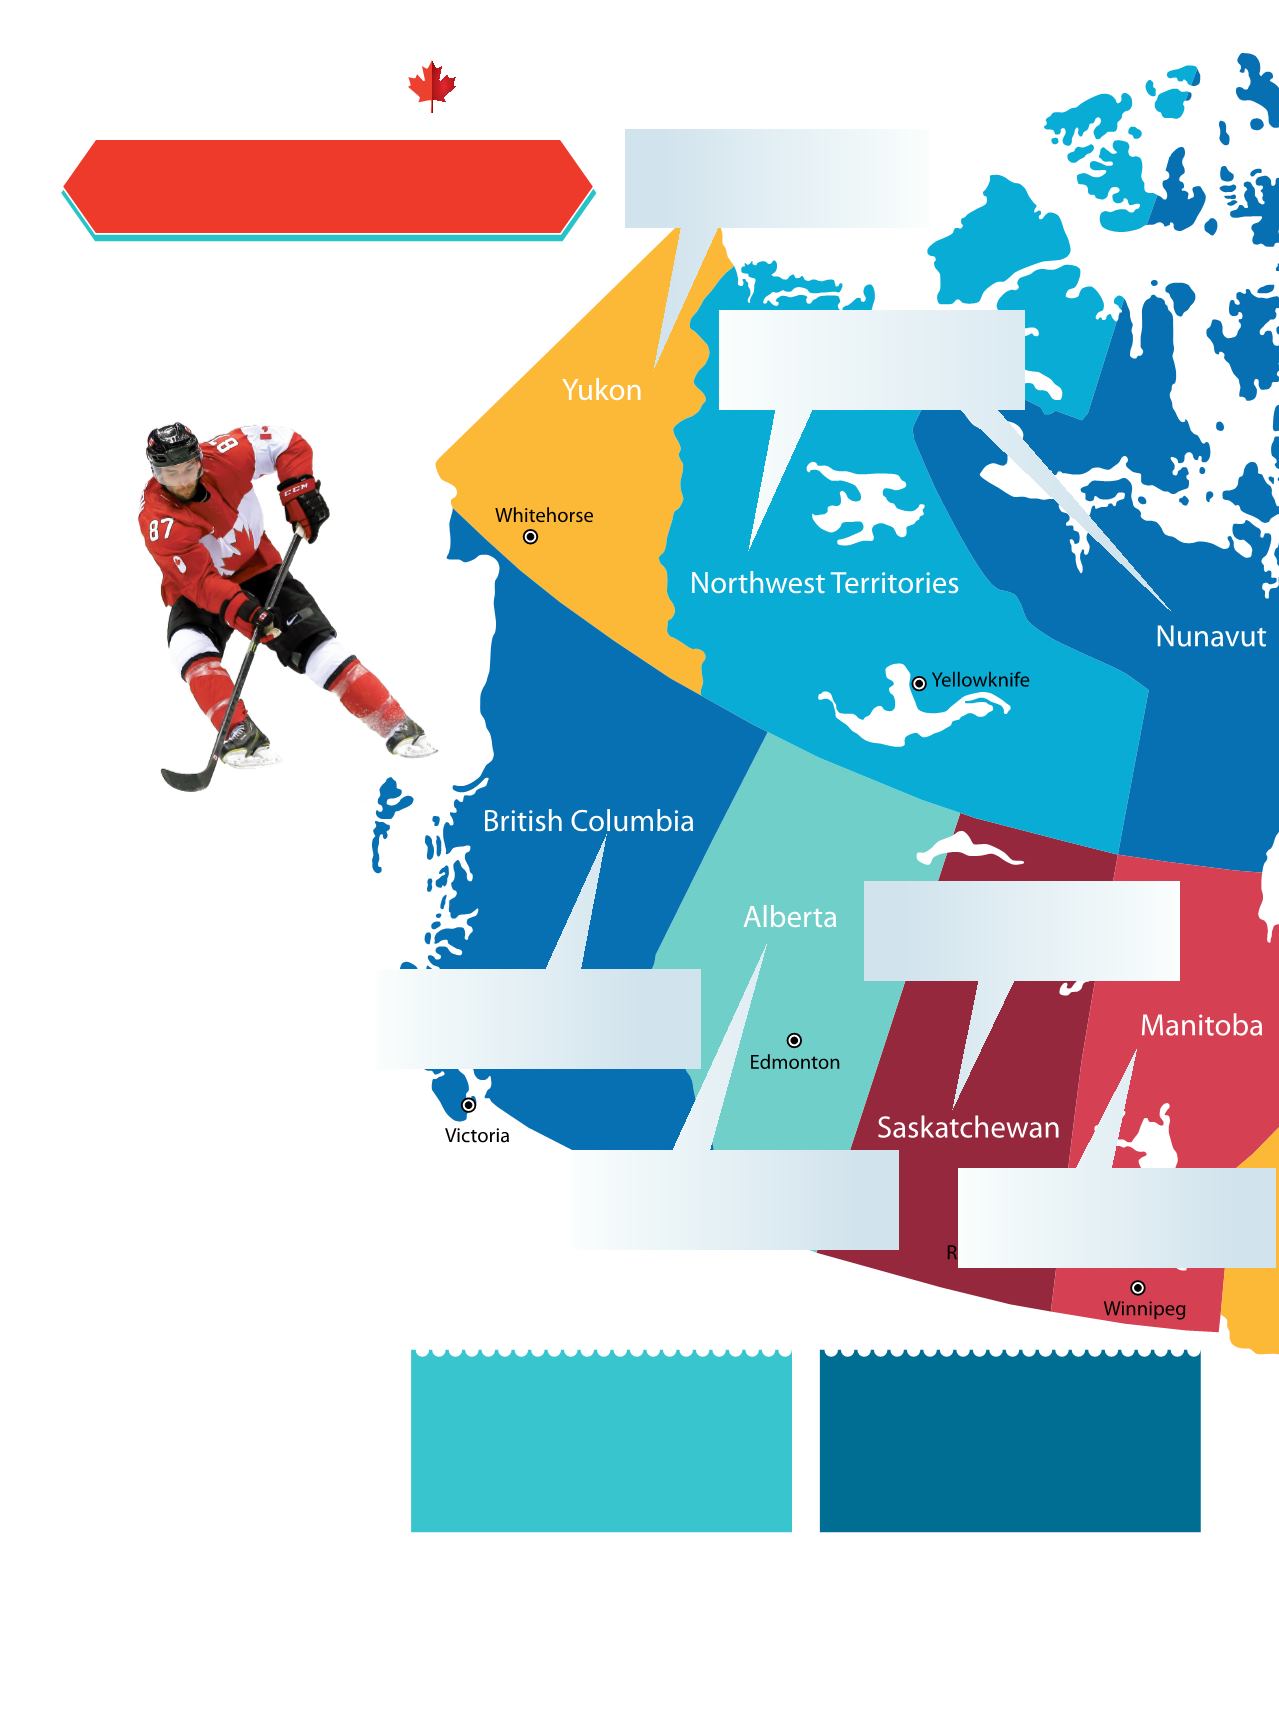
# of Rinks/Arenas...........7
Population........................37,400
Residents per rink..........5,343
# of Rinks/Arenas...........186
Population........................4,683,100
Residents per rink..........25,178
canada
# of Rinks/Arenas...........
2,460
Population........................
35,851,800
Residents per rink..........
14,574
# of Rinks/Arenas...........420
Population........................4,196,500
Residents per rink..........9,992
# of Rinks/Arenas...........203
Population........................1,293,400
Residents per rink..........6,371
# of Rinks/Arenas...........165
Population........................1,133,600
Residents per rink..........6,870
# of Rinks/Arenas...........10
Population........................81,000
Residents per rink..........8,100
Hockey and Canada
Some skate more:
the Canadian average is one hockey
rink for every 14,573.9 residents, but the
B.C average is one rink for every 25,178
residents. Meanwhile in P.E.I there is a
hockey rink for every 5,422 residents!
Jobs, Jobs, Jobs::
Canada has 5,000 full-time hockey jobs,
thousands more part-time hockey jobs
and some 150,000 hockey volunteers
contributing and average of five hours
per week, according to Scotialbank.
A 2015 report
published by
Scotiabank,
The
Economic Impact
of Hockey in Canada
found that, not only
were there some
2,460 hockey rinks
in Canada, but that
hockey had a direct
economic impact of
$2.6B on communities
across the country.
This economic activity
is driven by tourism,
the NHL and corporate
sponsorships.
Sources:
http://www.scotiabank.com/ca/common/pdf/Ice-Hockey-in-Canada-Summary-and-Infographic.pdf,
http://www.statcan.gc.ca/tables-tableaux/sum-som/l01/cst01/demo02a-eng.htm