


 17 / 32

The Dashboard
December 2016 //
Canadian Government Executive /
17
Sources:
Statistics Canada, Macleans Canada, Numbeo.
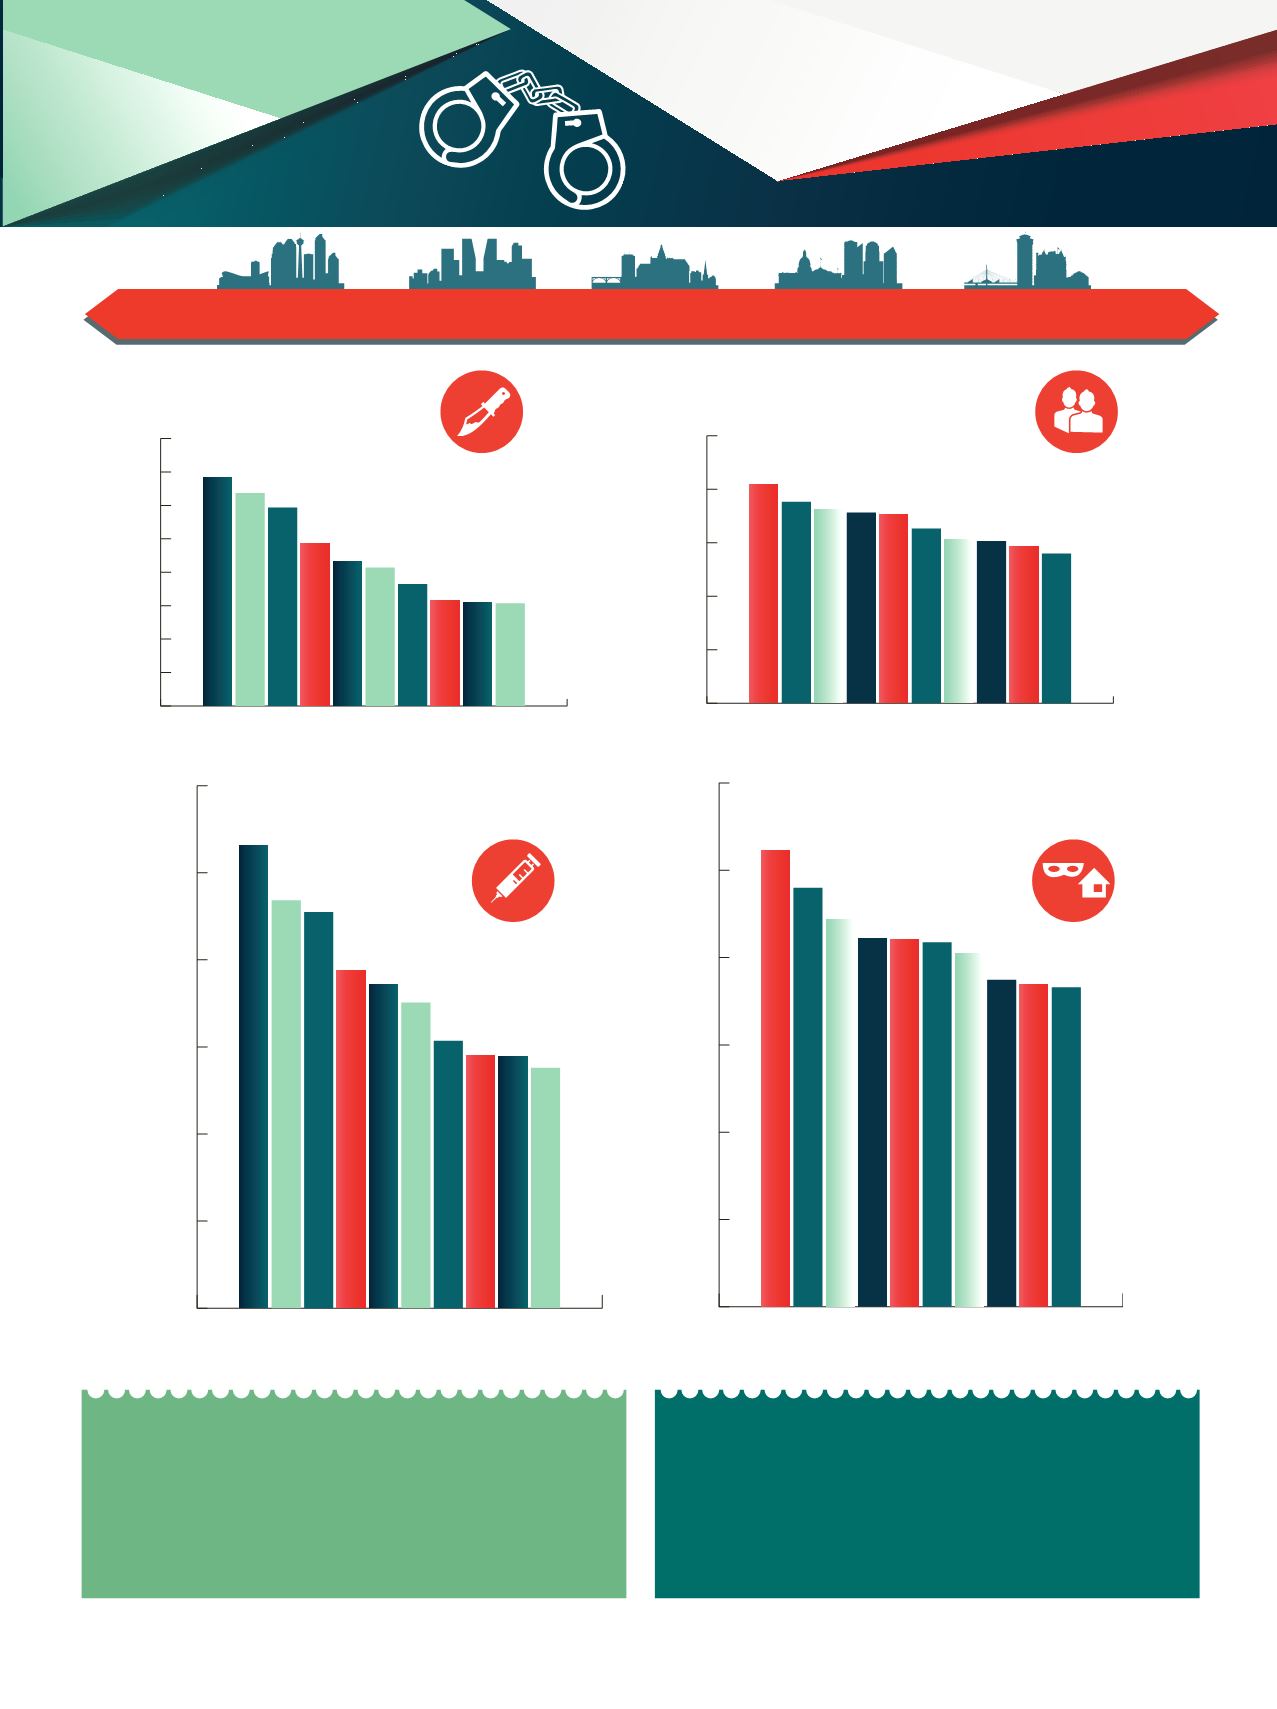
Worst Cities of Canada in 2015 (Rate per 100,000 population)
•There were almost 1.9 million Criminal Code
incidents (excluding traffic) reported by police in
2015, approximately 70,000 more than in 2014.
• In 2015, the police-reported CSI rose in 8 of the
13 provinces and territories.
The largest increases were reported in
• Alberta (+18%)
• New Brunswick (+12%)
• The Northwest Territories (+10%)
• Saskatchewan (+10%)
Fast facts
0
1
2
3
4
5
6
7
8
0
200
400
600
800
1000
1200
0
200
400
600
800
1000
1200
0
30
60
90
120
150
Canadian average ( 268.95 )
Canadian average ( 1.68 )
Canadian average ( 59.58 )
Canadian average ( 444.44 )
Homicide
Drug violations
Sexual Assault
Breaking and Entering
Fort McMurray
Grande Prairie
Red Deer
Prince George
Grande Prairie
Saskatoon
Vancouver
Nanaimo
Chilliwack
Surrey
Burnaby
Regina
Prince George
Kelowna
Beauharnois-Salaberry Region
Kamloops
Fort McMurray
Red Deer
Victoria
Nanaimo
Surrey
Saint John
Grande Prairie
Victoria
Lethbridge
Fredericton
Victoria
Peterborough-Lakefield
Terrebonne
North Bay
Prince George
Medicine Hat
Shawinigan Region
Winnipeg
Thunder Bay
Regina
Edmonton
South Simcoe
Saskatoon
Edmonton
6.84
123.9
1064.88
937.09
910.61
777.76
743.71
702.74
614.15
580.73
579.31
1046.19
960.56
888.2
849.51
843.67
835.78
810.26
749.17
738.41
732.86
552.48
113.6
109.8
107.4
106.8
98.1
92.2
91.5
88.5
84.3
6.37
5.94
4.86
4.33
4.14
3.65
3.16
3.1
3.07